Abstract
Football games and other sports broadcasts require a lot of information to help viewers understand what is happening as well as enhance their enjoyment of the game. A key portion of displaying this information comes from character generation (CG) graphics that are created during the live broadcast to display game scores and highlight important areas of the field. Character generation, which was created for a general election, became widespread across allThese graphics, a technique known as chroma keying, and holistic data collection done by broadcasting engineers allow for the first down line to be seamlessly plotted onto a football field. The collection process requires several sensors and digital mapping to get a consistent yellow line onto the field. The novelty and usefulness of the line is important when thinking about how information was distributed before the internet age.
Introduction
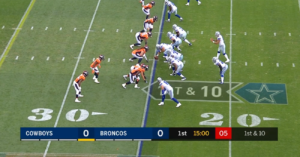
It’s gameday, your favorite day of the week. You’ve made plans to enjoy the football game at a friend’s place but you overslept. While hurriedly getting ready, you grab the chips he told you to bring and race to his house. As you sit down, you take a quick glance at the TV and a wealth of information is brought before your eyes. You are provided with several different facets of game data that enhances the viewing experience: you see the scores of both teams, who has possession of the ball, the line of scrimmage, the 1st down line and many more statistics, all from a single glance (Fig. 1).

Character Generators and its Origins
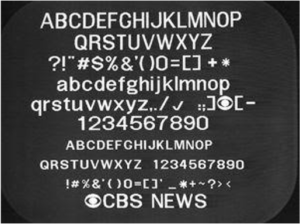
A character generator is a system that electronically outputs words and graphics onto a screen [2]. They create the lines, the logos, and the score boxes that are seen on sports broadcasts. Before the character generator existed, the way to make title graphics was to draw a graphic by hand, photograph it, and then fit the graphic onto a television screen. This process was called superimposition. By 1968, at the advent of the upcoming US election season this method of graphics creation came to be seen as inefficient, as the upcoming election would require over 8000 custom graphics for the large number of political figures campaigning for office. Superimposition was understandably not an efficient way to handle the broadcasting production. CBS Laboratories was tasked with a way to store letters and logos that could then be put up in various orders, allowing for custom graphics that could be created on the spot. The method they came up with to achieve this was to hold unique electronic codes for each symbol, so that a machine would be able to recognize the code and output the appropriate symbol. This system became known as the Vidifont [3].

The 1st and 10 Line
As character generators became commercially available to studios, they also became widespread across broadcast television. Almost every channel began to use it, including sports broadcasts. As the technological age advanced, so did character generation, which leads to the graphics that would start to effectively enhance the sports viewing experience. In 1997, ESPN started to broadcast football games with a virtual yellow line marker on the field to indicate the 1st down line, the same one that can be seen in Fig. 1. This became known as the 1st and 10 line. It immediately stunned viewers and quickly became a staple of the modern TV football experience. However, there were several technological hurdles that had to be overcome to achieve this goal.
The main issue was how to chroma key a line onto a field. The technique of chroma keying is to replace colors of a video or picture with other colors [4]. For example, if someone were to stand behind a green screen, the green background could be replaced with images of various places of the world with chroma keying. However, there are key shortcomings of chroma keying. If someone was wearing a green shirt, they would appear to not have a torso, or if the green screen were to suddenly become dark green, the background would break down. These were the issues that the producers of the yellow line, SportsVision, faced to an extreme degree. They had to deal with broadcasting in uncertain weather conditions, with variable fields of differing shades of green, as well as having a large crowd run all over said field, some of whom could be wearing similar shades of green as the field they were trying to chroma key [5]. Given these factors, calling the process of chroma-keying a yellow line onto a football field a challenge would be an understatement.
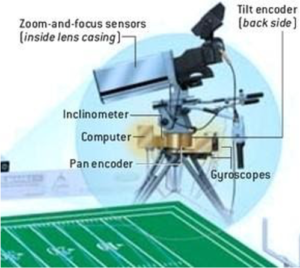
What SportsVision engineers did to accomplish the task was a multi-step process. It starts with initial preparation by surveying a field a few days before a game to digitally map it. During this time, they also calibrate the three main cameras that will be broadcasting the game, each of which are placed at a different location. The sensors on the cameras require this calibration, and they are a key portion of how the yellow line is made. As depicted in Fig. 3, there are several sensors that are added to the camera that reads vital data. Encoders, a type of sensor, record the pan (horizontal rotation) and tilt (vertical rotation) values of the camera. Other sensors record how zoomed in the camera is at any given time. An inclinometer is attached to the camera to record its height. The inclinometer is needed because as thousands of fans fill the stadium, the stadium will start to de-elevate, which messes up calculations if a constant height measured beforehand is used. A gyroscope is also attached to account for wind and other vibrations that could occur. All of these sensors are then fed into a computer that references the digital map of the field to plot a line on the field. The broadcast technicians don’t just fully trust the cameras either, they make sure to inspect the lines live in their production stations to see if they are looking as perfect as expected [6]. This all combines into the dainty yellow line that is seen on game day. The data they collect isn’t just used for the yellow lines, it allows them to put other virtual markers wherever they want on the field such as the 1st and 10 banners seen in Fig. 1.

Conclusion
While you are sitting down and watching a televised game of basketball or football, you need a lot of information to be able to enjoy the game. Imagine trying to watch a football game without knowing the down a team is on, how much time is left, or even the score? One of the key things character generation graphics gave us was a simplified way to broadcast information to the viewer, whether it was the name of a Senate member or the time left in the 4th quarter. We live in a world that is privileged enough that information on close to anything can be found in less than a second. While this information age is wonderful it’s important to remember how people got information before the internet. Nowadays you can get play-by-play updates on a game while on the go, with curated highlight videos being posted minutes after they happen. But in 1997, if you wanted to get the latest news on the game, you had to be watching. And even then, you had to be paying rapt attention or it would be difficult to actually understand the information. That is why innovations like the 1st down line were some of the precursors to allowing consumers to have all the information they want, whenever they want. It’s something to feel grateful for, but we can’t forget the engineering that made this technology possible.
References
[1] “Quick Guide to NFL TV Graphics,” National Football League, [Online]. Available: https://operations.nfl.com/football-101/quick-guide-to-nfl-tv-graphics/. [Accessed 31 January 2020].
[2] J. Owens, “Graphics,” in Television Sports Production, 5th ed., Waltham, MA: Focal Press, 2015.
[3] S. Baron, “First-Hand:Inventing the Vidifont: the first electronics graphics machine used in television production,” United Engineering Foundation, 14 December 2008. [Online]. Available: https://ethw.org/First-Hand:Inventing_the_Vidifont:_the_first_electronics_graphics_machine_used_in_television_production. [Accessed 30 January 2020].
[4] “The Making of Football’s Yellow First-and-Ten Line,” United Engineering Foundation, June 2010. [Online]. Available: https://ethw.org/The_Making_of_Football%27s_Yellow_First-and-Ten_Line. [Accessed 29 January 2020].
[5] J. Fong, E. Caswell and G. Barton, How the NFL’s magic yellow line works, New York, NY: Vox, 2016.
[6] “Phantom Gain,” Scientific American, vol. 290, no. 1, pp. 100-101, January 2004.


