
Abstract
Netflix is the world’s number one streaming platform with more than 200 million paid monthly subscribers in 2021. In its mission to entertain the masses, Netflix has a secret weapon: its recommendation system, which curates user specific content from Netflix’s massive media library for every single one of its 200 million users. Humans can be bad at decision-making and can get overwhelmed when there is a sizable list of similar options. Recommendation systems help users navigate this process by listing the items that the algorithm calculates that the user would enjoy and eliminating other unnecessary items. The more time a user spends on Netflix, the more insights Netflix can gather, and the better it is trained to make more personalized recommendations. Although most technology, including the Netflix recommendation system, is made to help consumers, users need to be intentional in how they interact with such technology to be mindful of how it influences the entertainment content they consume.
Introduction
It’s another night during the COVID-19 lockdown, and you probably don’t even know what day of the week it is. Bored in your house, you grab your laptop, climb into bed, and open Netflix without thinking twice. What show do you click on? Maybe something from your previously watched list that you’ve been binge-watching? Or perhaps you’re feeling adventurous and choose a new show from Netflix’s Top 10 after seeing its exciting trailer. You could be in the mood for a specific genre, so you search for the corresponding category and scroll until something feels right. Anyway, you start your show, satisfied with your choice, and spend the rest of the night immersed in the world you picked. But wait a second… How did Netflix know what you would like? How does it know what content to recommend to you? Moreover, how much control do you have over the algorithm choosing the content you want to see?
Reinventing Television – the Evolution of Netflix’s Recommendation Engine
What once began two decades ago as a tiny startup begging to be acquired by Blockbuster for a mere 50 million dollars has turned into the world’s biggest streaming platform. But how did Netflix get there? In its early days, Netflix was a DVD rental subscription service that offered unlimited DVD rentals without return dates, late fees, or monthly rental limits. It used a simple 5-star rating-based recommendation system. People were prompted to rate the movies they rented upon its return, so ratings were the only accurate way of knowing that someone actually watched the DVD [1]. The 5-star recommendation system helped Netflix to collect meaningful data. The higher the rating, the better the quality of the DVDs, and the more likely other customers would enjoy it too. Despite Netflix’s successful and expanding DVD delivery business, it didn’t become the number one streaming platform in the world by staying stagnant, and so they pivoted into a new business venture.
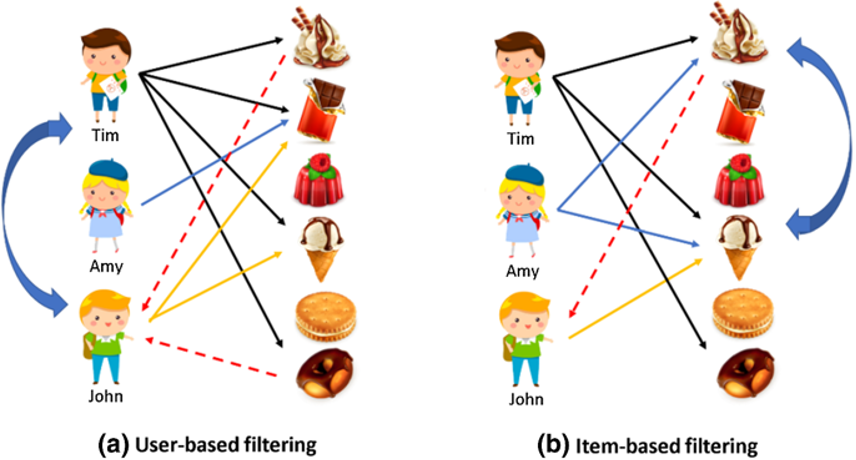
As the internet started to experience hypergrowth, Reed Hastings, the CEO of Netflix, identified Netflix’s unique advantage to combine skillful storytelling with the distribution power of the internet to provide the best viewing experience to its users [1]. In 2007, Netflix introduced its first streaming service, Watch Now, and canceled its money-making DVD delivery service a year later [2]. In 2009, Netflix launched the Netflix Prize with the goal to enhance the user experience by 10% or more. The team that won the $1 million prize developed a complex collaborative filtering recommendation system, consisting of more than 100 different predictor sets. Collaborative filtering is a machine learning method that uses data from past user behaviors to analyze relationships between “users and interdependencies among products to identify new user-item associations” [3]. There are two variants of collaborative filtering: user-based (UBCF) and item-based (IBCF). UBCF intuits that people who have similar opinions in the past are likely to share the same opinions again in the future, while IBCF suggests that people will always want similar items [4].
To implement UBCF and IBCF, users and items are characterized as vectors based on item rating patterns. Subsequently, matrix factorization methods are applied to these vectors. For an item i, qi measures how strongly (positive) or weakly (negative) the item possesses a list of factors, such as character development or a romantic ending. For a user u, Pu measures the user’s degree of interest in items based on the same factors. By calculating the dot product of two vectors, both containing multiple scores, this results in a single number that estimates the user’s interest in the item’s characteristics, denoted as
Rui = qi ∗ Pu (1)
Rui could be used to represent user u’s rating of item i without user u ever having to view item i. Using equation (1), the dot product of every item’s factors and user’s interests can be calculated, resulting in a very accurate estimate of every user’s rating of any item. Other equations are also created to account for biases. For example, some users tend to give lower ratings than others, or popular items produced by big movie studios tend to receive higher ratings. The new estimated rating accounts for bias (bui ) and is adjusted accordingly by adding both the item bias (bi) and user bias (bu) to the original rating [3].
bui = u + bi + bu (2)
One major benefit of the matrix factorization approach is that it has the flexibility to deal with a plethora of data points. In the case of Netflix, the data aspects on items can include genres, casts, length of the content, age of the user, and more. User interest, on the other hand, can be tracked using metrics such as view count, number of episodes viewed consecutively, and the time of the day the user is usually on Netflix. No longer constrained by the simple 5-star rating, the recommendation system can be adjusted to find the personalization sweet spot for individual users using content characteristics and watching habits.
Streaming into a New Era
In 2010, three years after launching its first streaming service, Netflix’s streaming service began to take off. Since Netflix uses a subscription-based business model, Netflix generates revenue from its monthly subscription fees. Thus, to sustain the business in the long run, retaining its existing user base is a top priority. Netflix needs to make sure that users continue to use Netflix month after month and don’t cancel their subscriptions. In order for users to keep paying for their monthly subscription fee, users need to feel like they are getting their money’s worth. They need to watch at least one show or movie per month or be excited about new content that is arriving next month, so they don’t feel the need to unsubscribe from Netflix. Unlike the advertising-based business model, as seen in Google or Facebook, where time spent directly correlates to advertising revenue, Netflix can focus less on the total time users spend on the platform. Instead, Netflix needs to understand how users spend their time and ensure that they get matched to content that interests them. Netflix attributes its ability to reduce monthly churn, the number of monthly unsubscribers divided by the number of subscribers, to a single digit percentage to its recommendation system. In a published paper on Netflix’s Recommender System, Netflix employees stated “the combined effect of personalization and recommendations saves us more than $1B per year” [1].
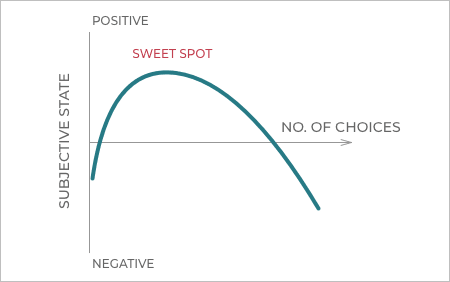
People Hate Choices
At its core, recommendation systems help people choose. John Ellis, a British TV producer and professor, writes in his book Seeing Things: Television in the Age of Uncertainty, “To choose is to be aware of alternative possibilities, possibilities that are being missed” [6]. It is this fear of missing out on other options that quickly overwhelms people and paralyzes them into not making decisions. Netflix collected data on its users’ behaviors and concluded that “a typical Netflix member loses interest after perhaps 60 to 90 seconds of choosing, having reviewed 10 to 20 titles (perhaps 3 in detail) on one or two screens” [1]. Netflix’s recommendation algorithm must suggest something interesting enough to the user in less than 1.5 minutes before the user decides to close the Netflix tab and visits another streaming platform.
Magic on the Homepage
No matter which device you watch Netflix on, you always land on the homepage first. According to a research paper published by Netflix on ACM, 80% of hours streamed are a result of the recommendation system on the homepage, while the remaining 20% are from search [1]. For easy and intuitive navigation, Netflix uses a grid layout to display rows and rows of content. This allows users to dive deeper into a specific genre or skip rows that don’t interest them.
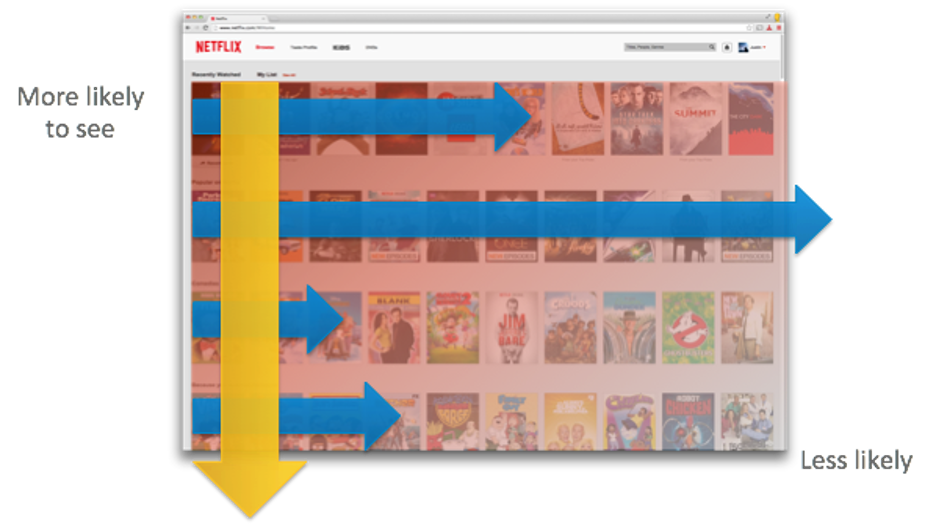
It is crucial for Netflix to place the content that users are most interested in watching in the top left corner. Several algorithms are used to generate the grid. Starting with the Personalized Video Ranker (PVR), it generates a unique catalog order for each account based on the member’s past viewing habits. This resulting catalog order is then used to generate genre-based rows and determine how content in the same row is ordered. Therefore, users could have completely different content in rows that have the same genre name, such as suspense.
After PVR narrows down the catalog, the Top N video rankers look at the top of the rankings to identify the most relevant videos for each user and list them in a new row. Other rows such as Trending Now, Continue Watching, and Because You Watched (BYW) are also created using algorithms. Specifically, BYW is generated by a video to video similarity algorithm, a type of item-based collaborative filtering (IBCF). A ranked list of videos is computed for every video in the catalog. Then, the subset of the list with the highest similarity based on the member’s preferences is added to the BYW row [1]. Once tens of thousands of rows are generated, the Page Generation algorithm displays the most relevant rows for each user, eliminates any content duplication, and preserves the diversity of the page by avoiding repeating similar genres. Ta-da a customized page just for you!
A Picture is Worth a Thousand Words
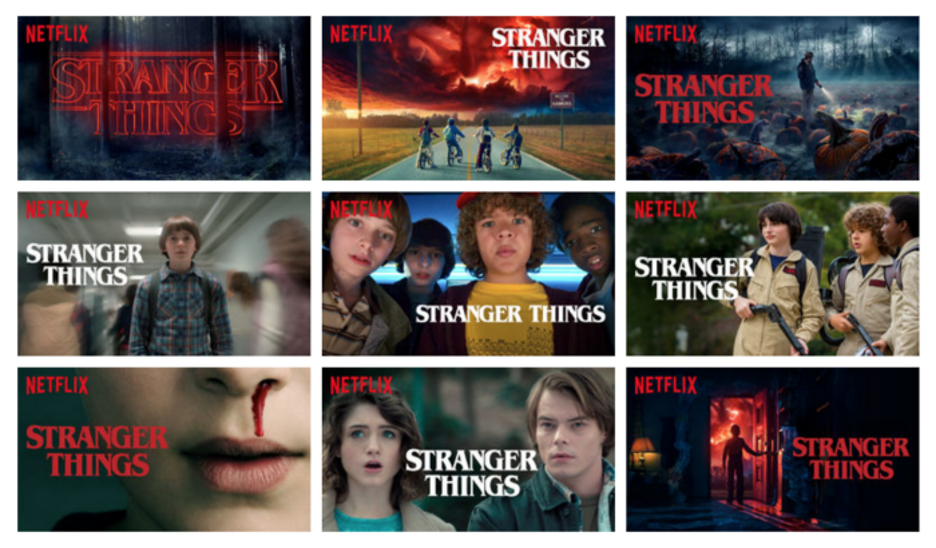
Now that your personal grid is full of titles of content that Netflix thinks you will enjoy, can you finally start watching? Not quite, there is one more step — generating specific metadata for each TV show and movie, such as cover art, synopsis, cast, and sub-genres. This metadata is the final step to convince you to click on the shows the recommendation system has selected for you. According to Neuroscientists from MIT, the human brain can take as little as 13 milliseconds to process an image [10]. Since cover art takes up the most space on your screen, when the perfect image is displayed on your homepage, you won’t be able to ignore it. For Stranger Things, the most binged-watched show on Netflix in 2019, the covers shown in the figure below were specifically made for different users, with varying shots, font colors, sizes, and placements.
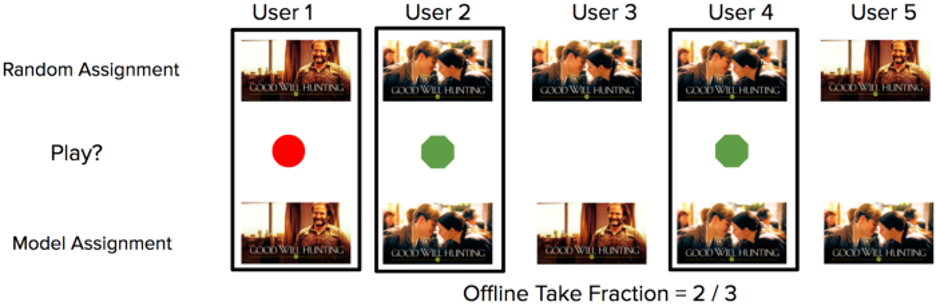
To evaluate the performance of the image selection and customization algorithms, an extensive amount of data needs to be collected and evaluated to indicate when one piece of artwork is significantly better for a user. Netflix does this in two ways: offline and online evaluation.
Where Did Our Time Go?
Netflix has perfected the best way to select and present content to you and it has had an irreversible effect on all of us. During quarantine, on average, Americans watch more than 3.2 hours of Netflix per day, a 20% increase from 2019 [12]. Combined with the addictive nature of social media, Ellis reveals that “there is a feeling among audiences that we no longer have spare time, are no longer required to kill time, and feel very uneasy with the thought of ‘wasting time”‘ [6]. There is little to no barrier to access any information that we want. We can watch several decades of TV shows, movies, and documentaries at the tip of our fingers and in the comfort of our own homes. Oftentimes, we ask ourselves ‘where did my time go?’ after staring at our TVs or phones for hours and hours, a phenomenon known as time famine. Time famine also contributes to the partial choice paralysis, the hesitation that arises when all possibilities seem equally attractive yet the person is aware that there is not enough time to experience all of them. Netflix helps us make decisions easier and faster by recommending specific content filled with personalized cover art. We then experience time famine as we binge multiple episodes in one sitting, which feeds back into our inability to choose between similar content and results in partial choice paralysis.
Conclusion
Netflix would not be as successful as they are today without their recommendation system that not only selects the most relevant content for each individual user but also customizes how content is displayed. Netflix has reinvented television by combining skillful storytelling with customized experiences for every single user and providing a massive library of content available to users anywhere and anytime. Netflix will continue to develop smarter recommendation algorithms and create original content. However, we as users need to be mindful of how we interact with Netflix and technology as a whole. Next time, before you open Netflix, take a minute to think about some shows you may want to watch today, and then see how accurate Netflix’s recommendations are in comparison to your own preferences? You could even try to decide on what to watch before you open Netflix to regain some control over your entertainment experience.
References
[1] C. A. Gomez-Uribe and N. Hunt, The Netflix Recommender System: Algorithms, Business Value, and Innovation, 01-Dec-2015. [Online]. Available: https://dl.acm.org/doi/10.1145/2843948. [Accessed: 04-Feb-2021].
[2] “How Netflix Became a $100 Billion Company in 20 Years,” Product Habits, 30-Apr-2018. [Online]. Available: https://producthabits.com/how-netflix-became-a-100-billion-company-in-20-years. [Accessed: 06-Feb-2021].
[3] Y. Koren, R. Bell, and C. Volinsky, “Matrix Factorization Techniques For Recommender Systems,” datajobs, Aug-2019. [Online]. Available: https://datajobs.com/data-science-repo/Recommender-Systems-[Netflix].pdf. [Accessed: 06-Feb-2021].
[4] R. Sharma, D. Gopalani and Y. Meena, “Collaborative filtering-based recommender system: Approaches and research challenges,” 2017 3rd International Conference on Computational Intelligence & Communication Technology (CICT), Ghaziabad, 2017, pp. 1-6, doi: 10.1109/CIACT.2017.7977363.
[5] G. Pipis, “Item-Based Collaborative Filtering in Python,” Predictive Hacks, 20-Jun-2020. [Online]. Available: https://predictivehacks.com/item-based-collaborative-filtering-in-python/. [Accessed: 07-Feb-2021].
[6] Samuel, Michael. “Time Wasting and the Contemporary Television-Viewing Experience.” University of Toronto Quarterly, vol. 86, no. 4, University of Toronto Press, 2017, pp. 78–89, doi:10.3138/utq.86.4.78.
[7] E. Semeijn, “Paradox of choice: why showing less to your customers is more!,” Neurofied, 10-Sep-2020. [Online]. Available: https://neurofied.com/paradox-of-choice-why-less-more/. [Accessed: 09-Feb-2021].
[8] C. Johnson, “Goodbye Stars, Hello Thumbs,” Netflix, 05-Apr-2017. [Online]. Available: https://about.netflix.com/en/news/goodbye-stars-hello-thumbs. [Accessed: 05-Feb-2021].
[9] C. Alvino and J. Basilico, “Learning a Personalized Homepage,” Medium, 19-Apr-2017. [Online]. Available: https://netflixtechblog.com/learning-a-personalized-homepage-aa8ec670359a. [Accessed: 08-Feb-2021].
[10] A. Trafton, “In the Blink of an Eye,” MIT News, 16-Jan-2014. [Online]. Available: https://news.mit.edu/2014/in-the-blink-of-an-eye-0116. [Accessed: 09-Feb-2021].
[11] A. Chandrashekar, F. Amat, J. Basilico, and T. Jebara, “Artwork Personalization at Netflix,” Medium, 07-Dec-2017. [Online]. Available: https://netflixtechblog.com/artwork-personalization-c589f074ad76. [Accessed: 08-Feb-2021].
[12] J. Cohen, “US Netflix Subscribers Watch 3.2 Hours and Use 9.6 GB of Data Per Day,” PCMAG, 01-May-2020. [Online]. Available: https://www.pcmag.com/news/us-netflix-subscribers-watch-32-hours-and-use-96-gb-of-data-per-day. [Accessed: 07-Feb-2021].